You can access the Dashboards and Reports that we have created and published to this website from the links at the bottom of this page.
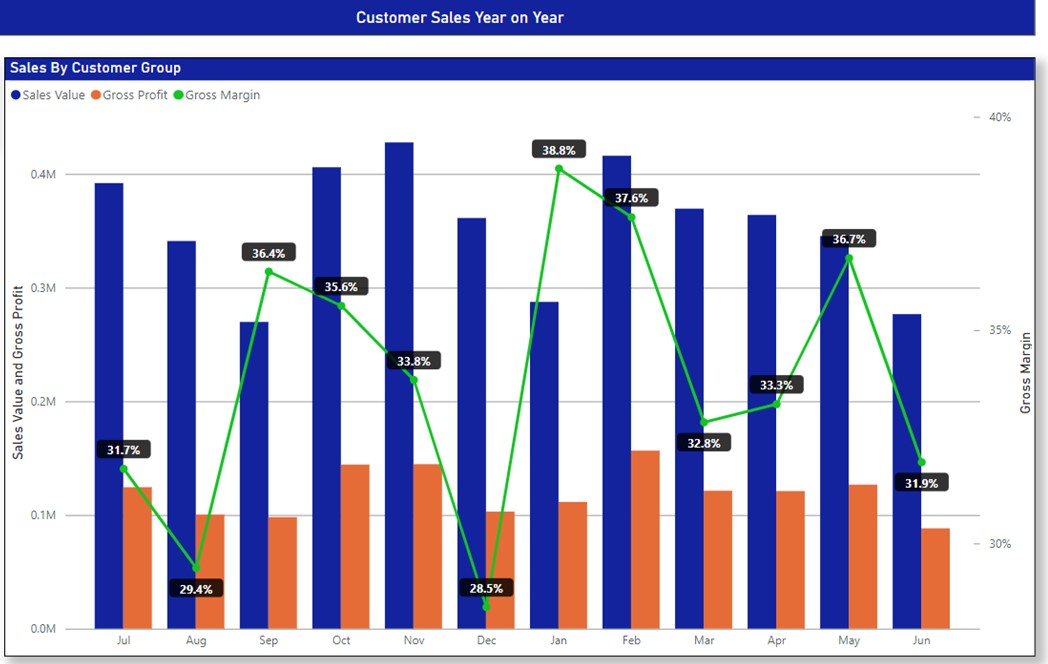
An example is shown below, a Combined Line and Column Chart, which shows for each month of the selected Financial Year, the Sales Values, the Gross Profits made, and the GP Margin.
Fluctuations in GP Margin can be easily identified by the green line, and lower than expected margins can be investigated further by drilling down to Customer Groups, to individual Customers, to Sales Invoices of each Customer, and to the Products sold on the sales invoices selected for investigation.
Discover Perennial BI for Sales Analysis
Perennial BI provides the visual insights that help Sales Teams easily identify the company's most profitable and
sought-after products. You can have a look at the Dashboards and Reports that we have created with sample data for
the Customer Sales Management function by
clicking here
You can scroll through each page one by one from the Page Number navigator at bottom right of each page. And of course, if you have any questions, or would like a guided tour, please refer to the Contact Us page to give us a call or send us an email so we can schedule a no obligation online meeting.