Business Intelligence tools unlock the data stored in complex ERP databases and provide visual dashboards and reports that drive you towards meeting the targets you have set for your business.
Perennial Software can work with you to develop a BI Performance Measurement and Reporting System that will enable you to:
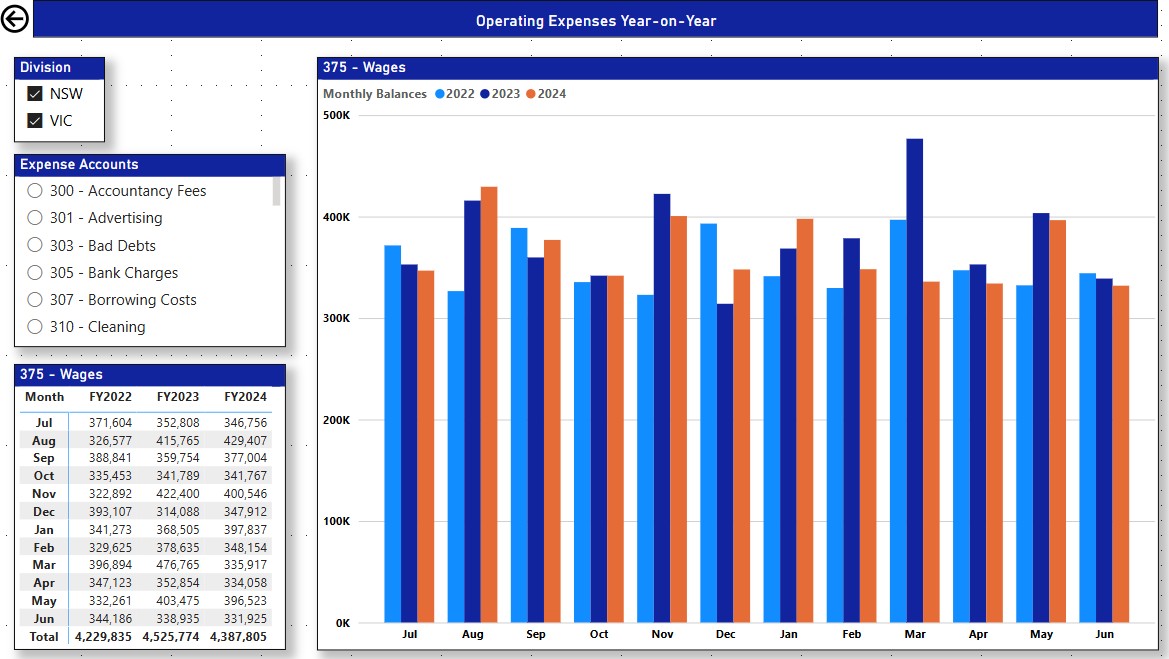
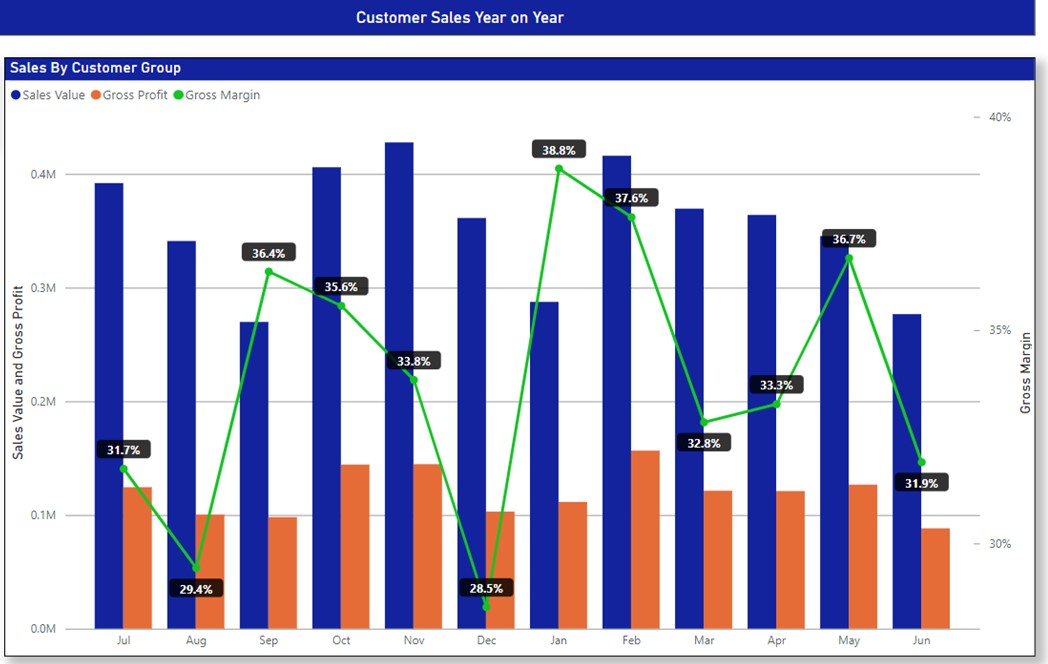
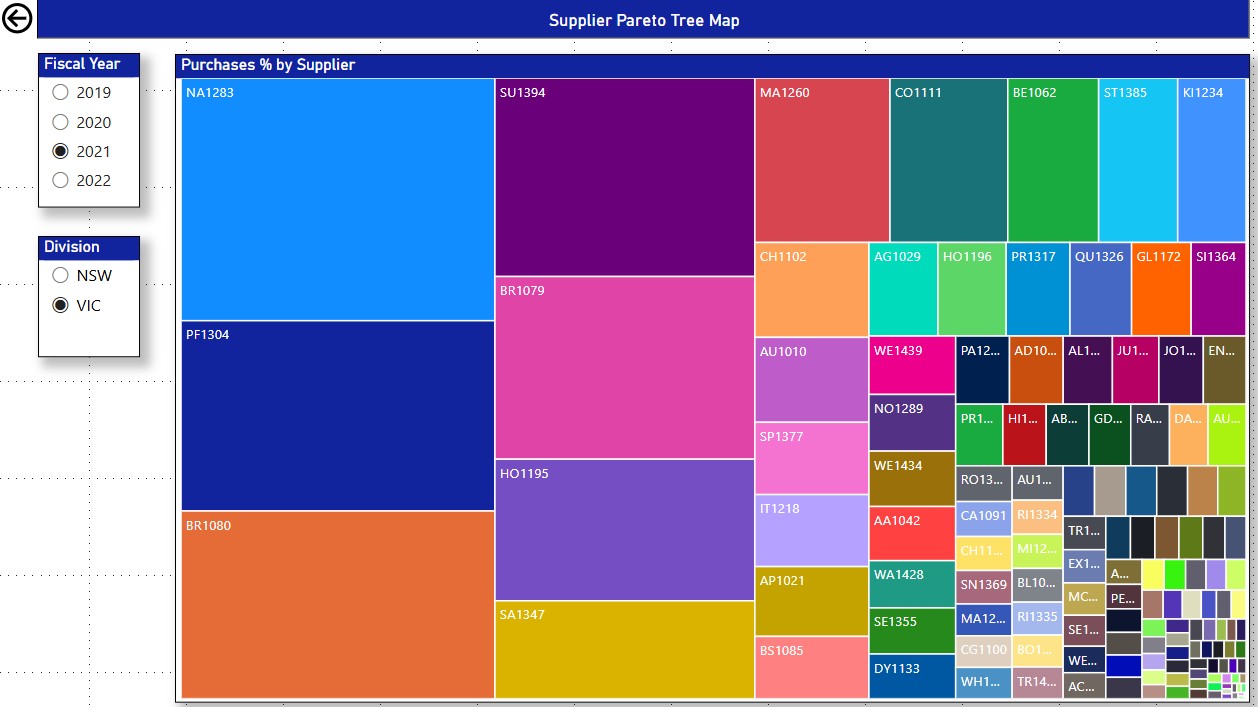
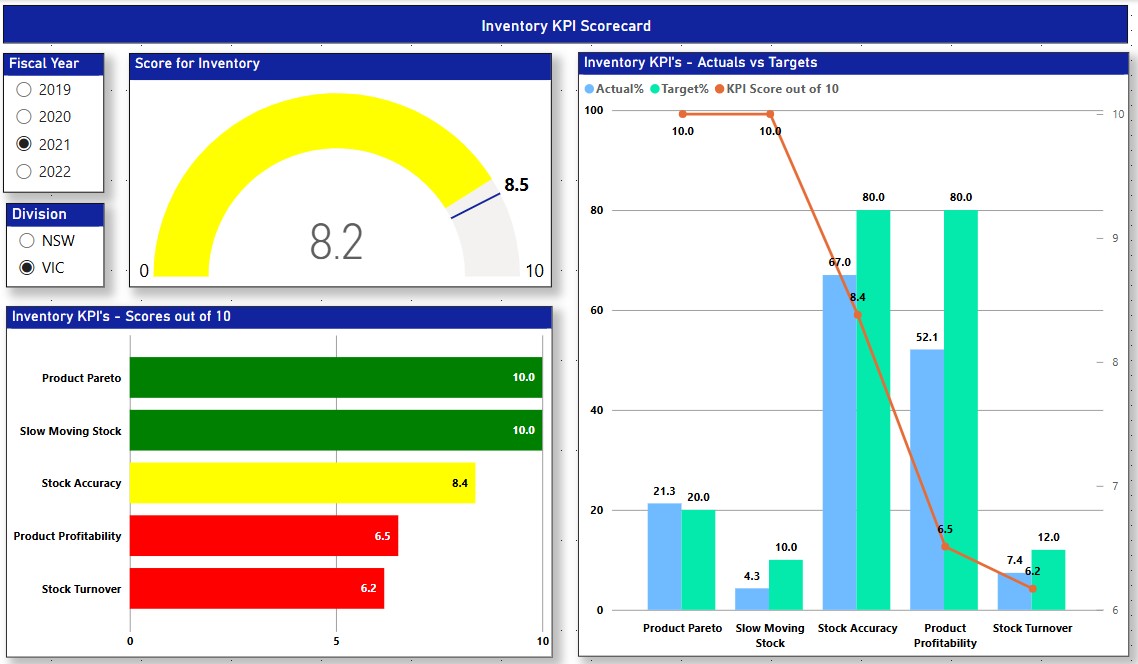
Perennial BI - Pre-Built Dashboards and Reports for Distributors of Durable Products - a great way to "quick-start" your Business Intelligence Experience
Using Microsoft Power BI, Perennial Software has already developed a substantial range of customizable Dashboards and Reports which we have called
Perennial BI for Product Distributors. So rather than starting from scratch, use what we have already created, and save many hours of time and money.
ETL - Extract, Transform and Load - ETL
Before you can use the Dashboards and Reports provided in Perennial BI, you have to "Get Data" from your ERP databases, and any other data sources that you use and wish to report on, transform it into a form data is suitable for Busines Intelligence reporting, and load the transformed data into the Perennial BI data model we have created in Power BI.
To assist you in this ETL process, Perennial BI also includes the SQL procedures and scripts that we used to load our sample data from
a non-SQL database into the SQL data warehouse - which can be the SQL Server database for on-premise or the Azure SQL database for cloud.
And we also include the SQL Server Integration Services (SSIS) package that we used to map the non-SQL database tables and fields to the
SQL data warehouse.
All of which can be customized and automated.
Self-Service BI
Perennial BI includes Data Models optimized for Power BI that make it easy for your Business Users to create new dashboards and reports that they might need. The visualization tools in Power BI make it quite easy for Business Users experienced in other software reporting tools, such as Microsoft Excel, to develop their own dashboards and reports. In fact, one of the key reasons companies are implementing Power BI is to transform the reports they have created in Excel to Power BI.
You can preview all the Dashboards and Reports that we have created in Perennial BI from the links below.
New dashboards and reports are being added constantly, and these will be provided to you once they become available. In addition, Microsoft release new versions of Power BI each month, with new features that can be downloaded from the Microsoft website. We will provide you with details on how to perform and install these downloads, and how to find out what they contain.